
Aerospace supply chain issues are making the headlines of printed and digital press almost every day. We keep on hearing on production issues, manufacturing delays, delayed shipments, missing raw materials, lack of capacity and manpower, and many other reasons for parts to be late. It seems the whole A&D supply chain is under high stress and in parallel major airframers keep increasing production rates with ongoing ambitious rates increases. We can always think that these extremely optimistic production forecasts are primarily done for the sake of financial communication, the truth is that all players are struggling day to day to cope with production schedules and that this stress is very, very real. The critical question is how the supply chain will withstand this ever-increasing manufacturing demand while at the same time we observe that on time delivery performance is slowly but surely going down across the industry. Safety margins are gone, and the next topic will be to assess impacts in terms of quality that this situation creates. In a nutshell, it is very likely that late deliveries across the board will lead to lower quality levels at the final assembly stage.
Given this bleak situational assessment, the major question for aerospace companies executives today is how they can keep their supply chain running, meaning with a minimal safety margin and no risk of stall, as this ecosystem is currently operating in an area similar to what pilot’s call the “coffin corner” when flying, meaning stability margin is nonexistent. So how do we recover some margin, some room to maneuver, and then improve the on-time delivery performance, save money, and get back to a safer operation point?
So, let’s have a look at the root causes of late deliveries in the US aerospace industry. Obvious answers will lead to lack of manpower, lack of material, increasing energy costs, low volume, and so on. But all these commonsense causes are applicable to all and furthermore, solutions are out of reach of both suppliers and customers, i.e., we will not change the labor market in California nor the price of oil that drives energy costs. So what? Let’s try something else.
At TRIGO, we are managing OTD & OQD of Aerospace suppliers (over 2000) for large customers (>200) and our daily work is to improve the performance of the supply chain. We are embedded in it; it is our bread and butter to be boots on the ground inside it and we can see a few interesting things that do not show up in the mainstream information on the supply chain situation. Let me explain.
Here are some examples of the data we are generating in our daily work:
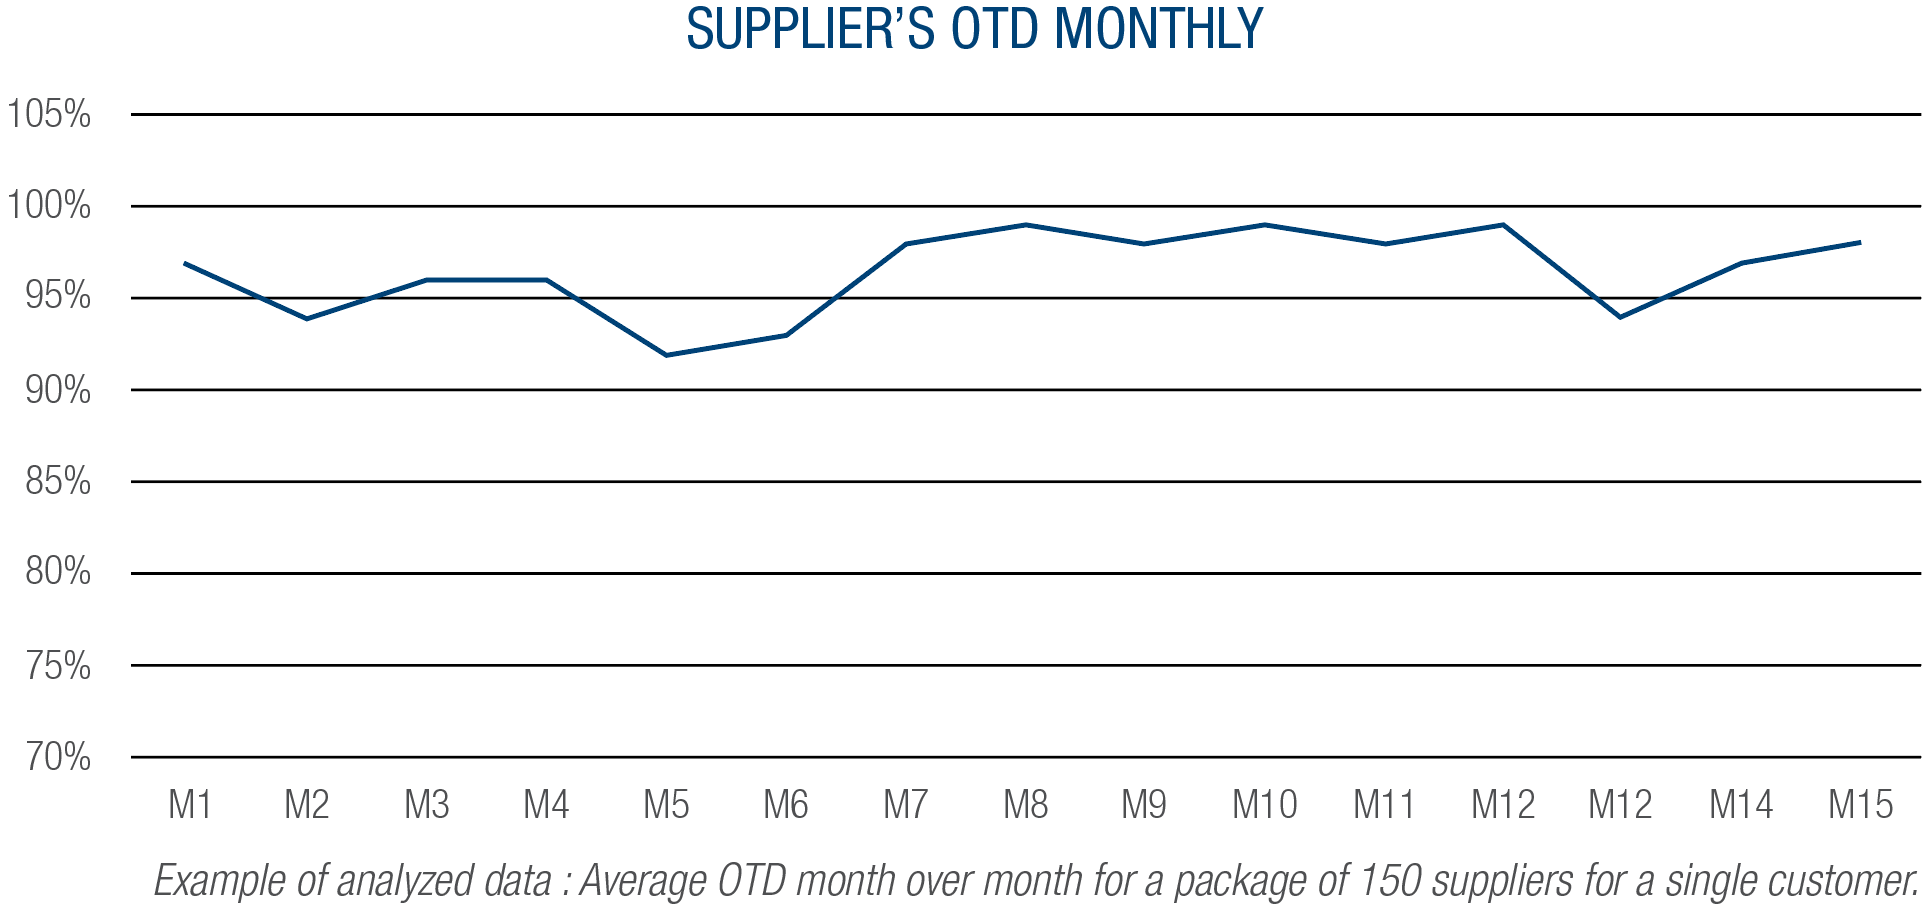
OTD is calculated by as (Total number of orders delivered on time in the month)/( total number of orders expected to be delivered in the month)
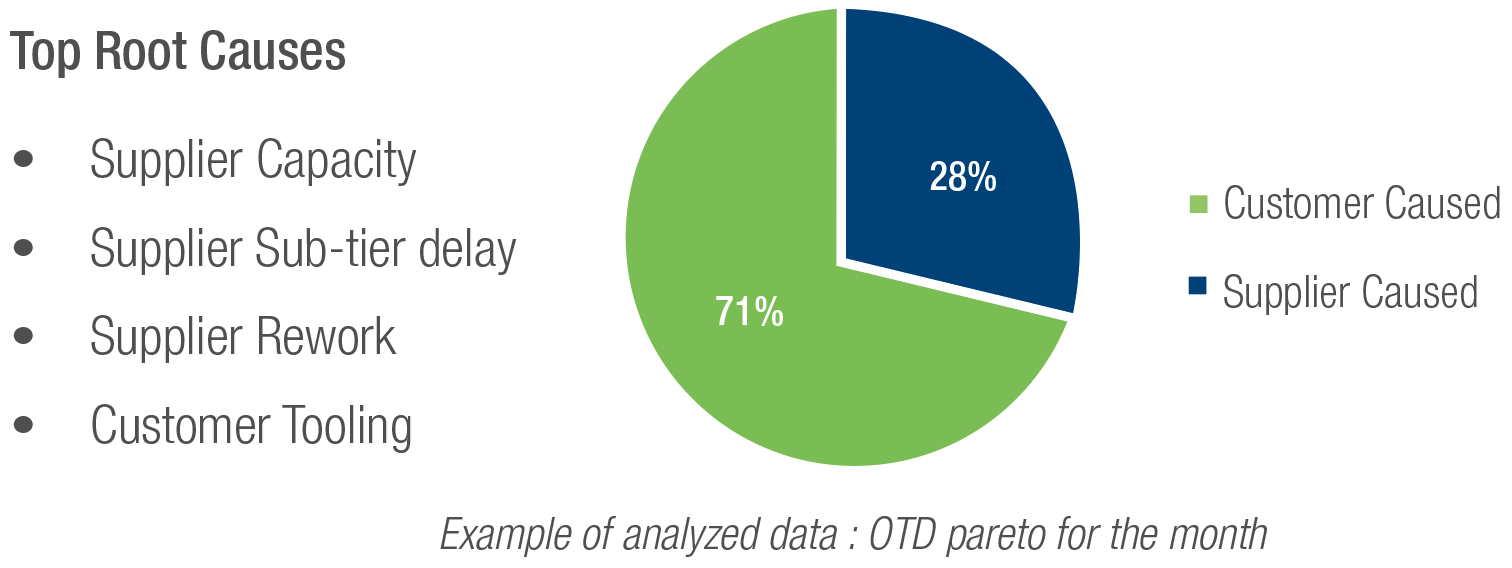
We also perform each month an analysis of all root causes leading to late deliveries. Example of analyzed data : Average OTD month over month for a package of 150 suppliers for a single customer.
OTD is calculated by as (Total number of orders delivered on time in the month)/( total number of orders expected to be delivered in the month)
We also perform each month an analysis of all root causes leading to late deliveries.
We have extracted and analyzed 18 months of OTD performance for around 500 suppliers in USA, covering each PO, each item, each delay, each root cause for each late delivery, each line of the corrective action plan and created a simple top of the mountain view.
What this view tells us is extremely interesting.
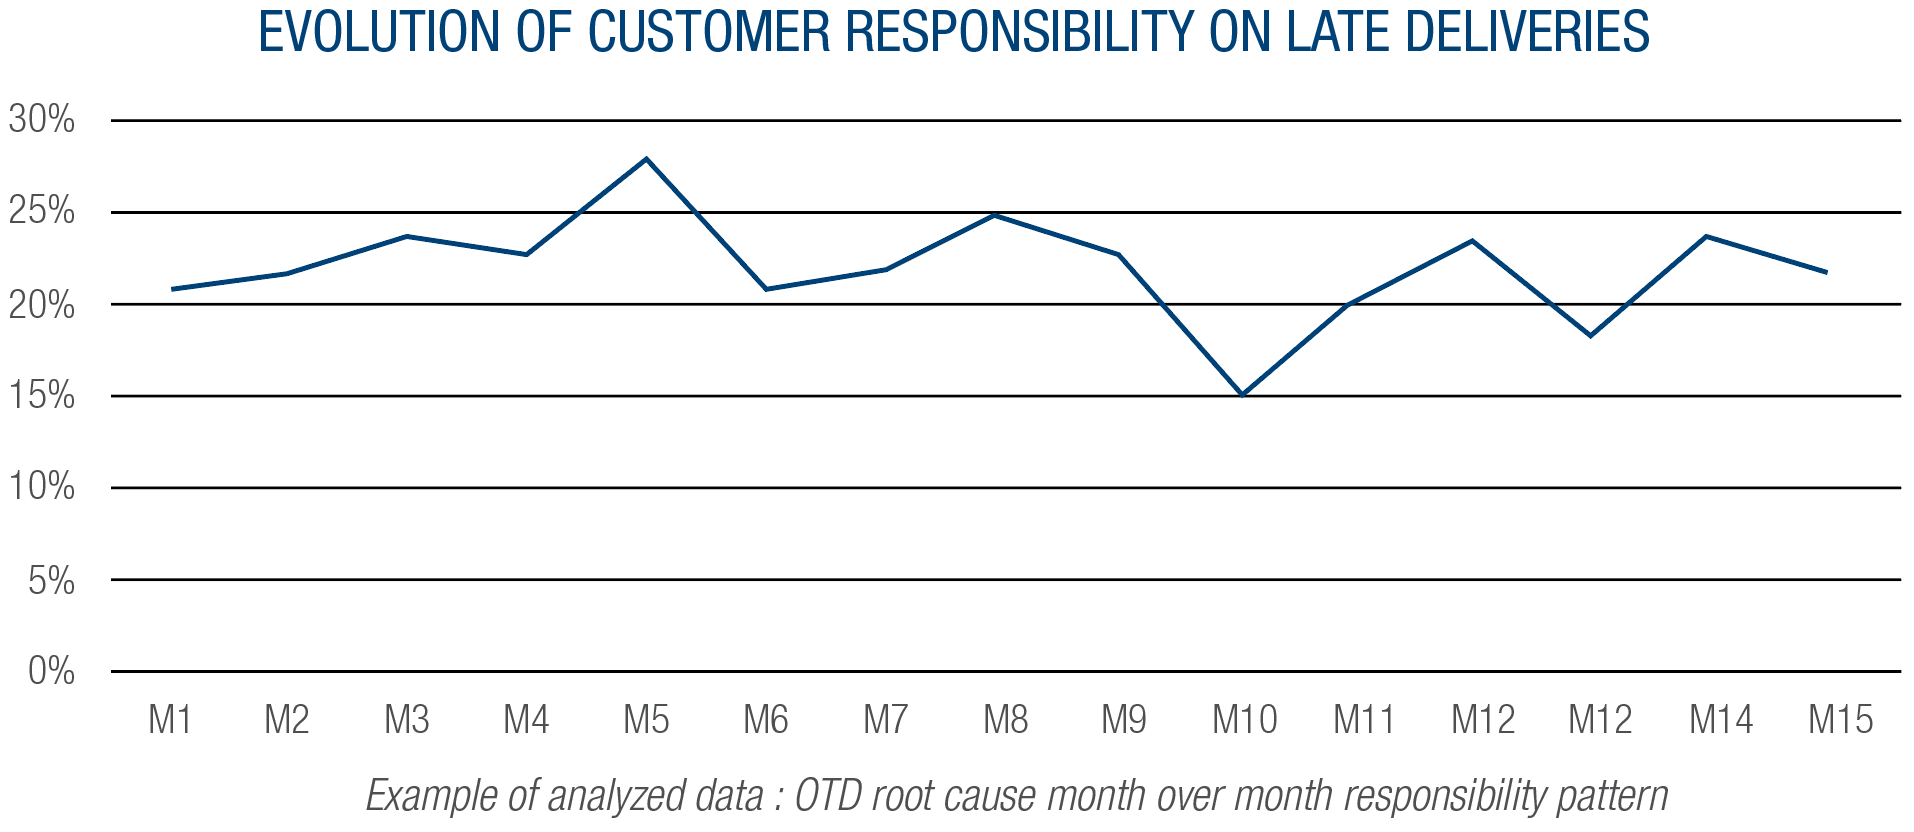
Our analysis demonstrates that when a supplier is late to supply its end customer, the responsibilities for this perturbation are much more balanced than one would believe. As an industry average, around 66% (2/3rd) of the late delivery events are the responsibility of the supplier. It means that, on average in US aerospace industry now, 33% of late deliveries are the responsibility of the end customer itself. And the root causes of these 33% are:
- Change of schedule
- Engineering changes, i.e., product definition maturity
- Manufacturing process changes requested by customer.
- Configuration issues
- Late arrival of customer provided material or equipment.
- Missing PO
- Zero delay or no date PO
- Late payments
And surprisingly here, we have none of the usual suspects (manpower, material, machining) that we are used to.
So here, we have clear evidence that 33% of the supply chain disruptions we are facing today are basically caused by the end customer themselves, some of them also do keep on complaining that their suppliers are hitting them very hard. So, let’s roll up our sleeves, by simply improving customers discipline, accountability, program management, and we have an opportunity to improve these 33% late deliveries across the whole aerospace supply chain performance. And this is achievable with the same suppliers, same product, same program, etc. ... A great improvement opportunity lies in front of us.
But let’s not stop here, let’s push a bit the analysis one step further, and give another very strong argument to this improvement program. The dataset we generated also shows a very interesting correlation between supplier performance and customer discipline.
It is represented on the graph below. Each blue dot represents a monthly dataset of a specific supply chain for one customer (usually around 100 suppliers). The blue dot is positioned in (X, Y) coordinates with the following rule, coming from the dataset reduction:
X Axis being the share of late deliveries that are the responsibilities of the customer in percentage for a given month
Y Axis being the OTD performance, monthly, of the supply chain subset.
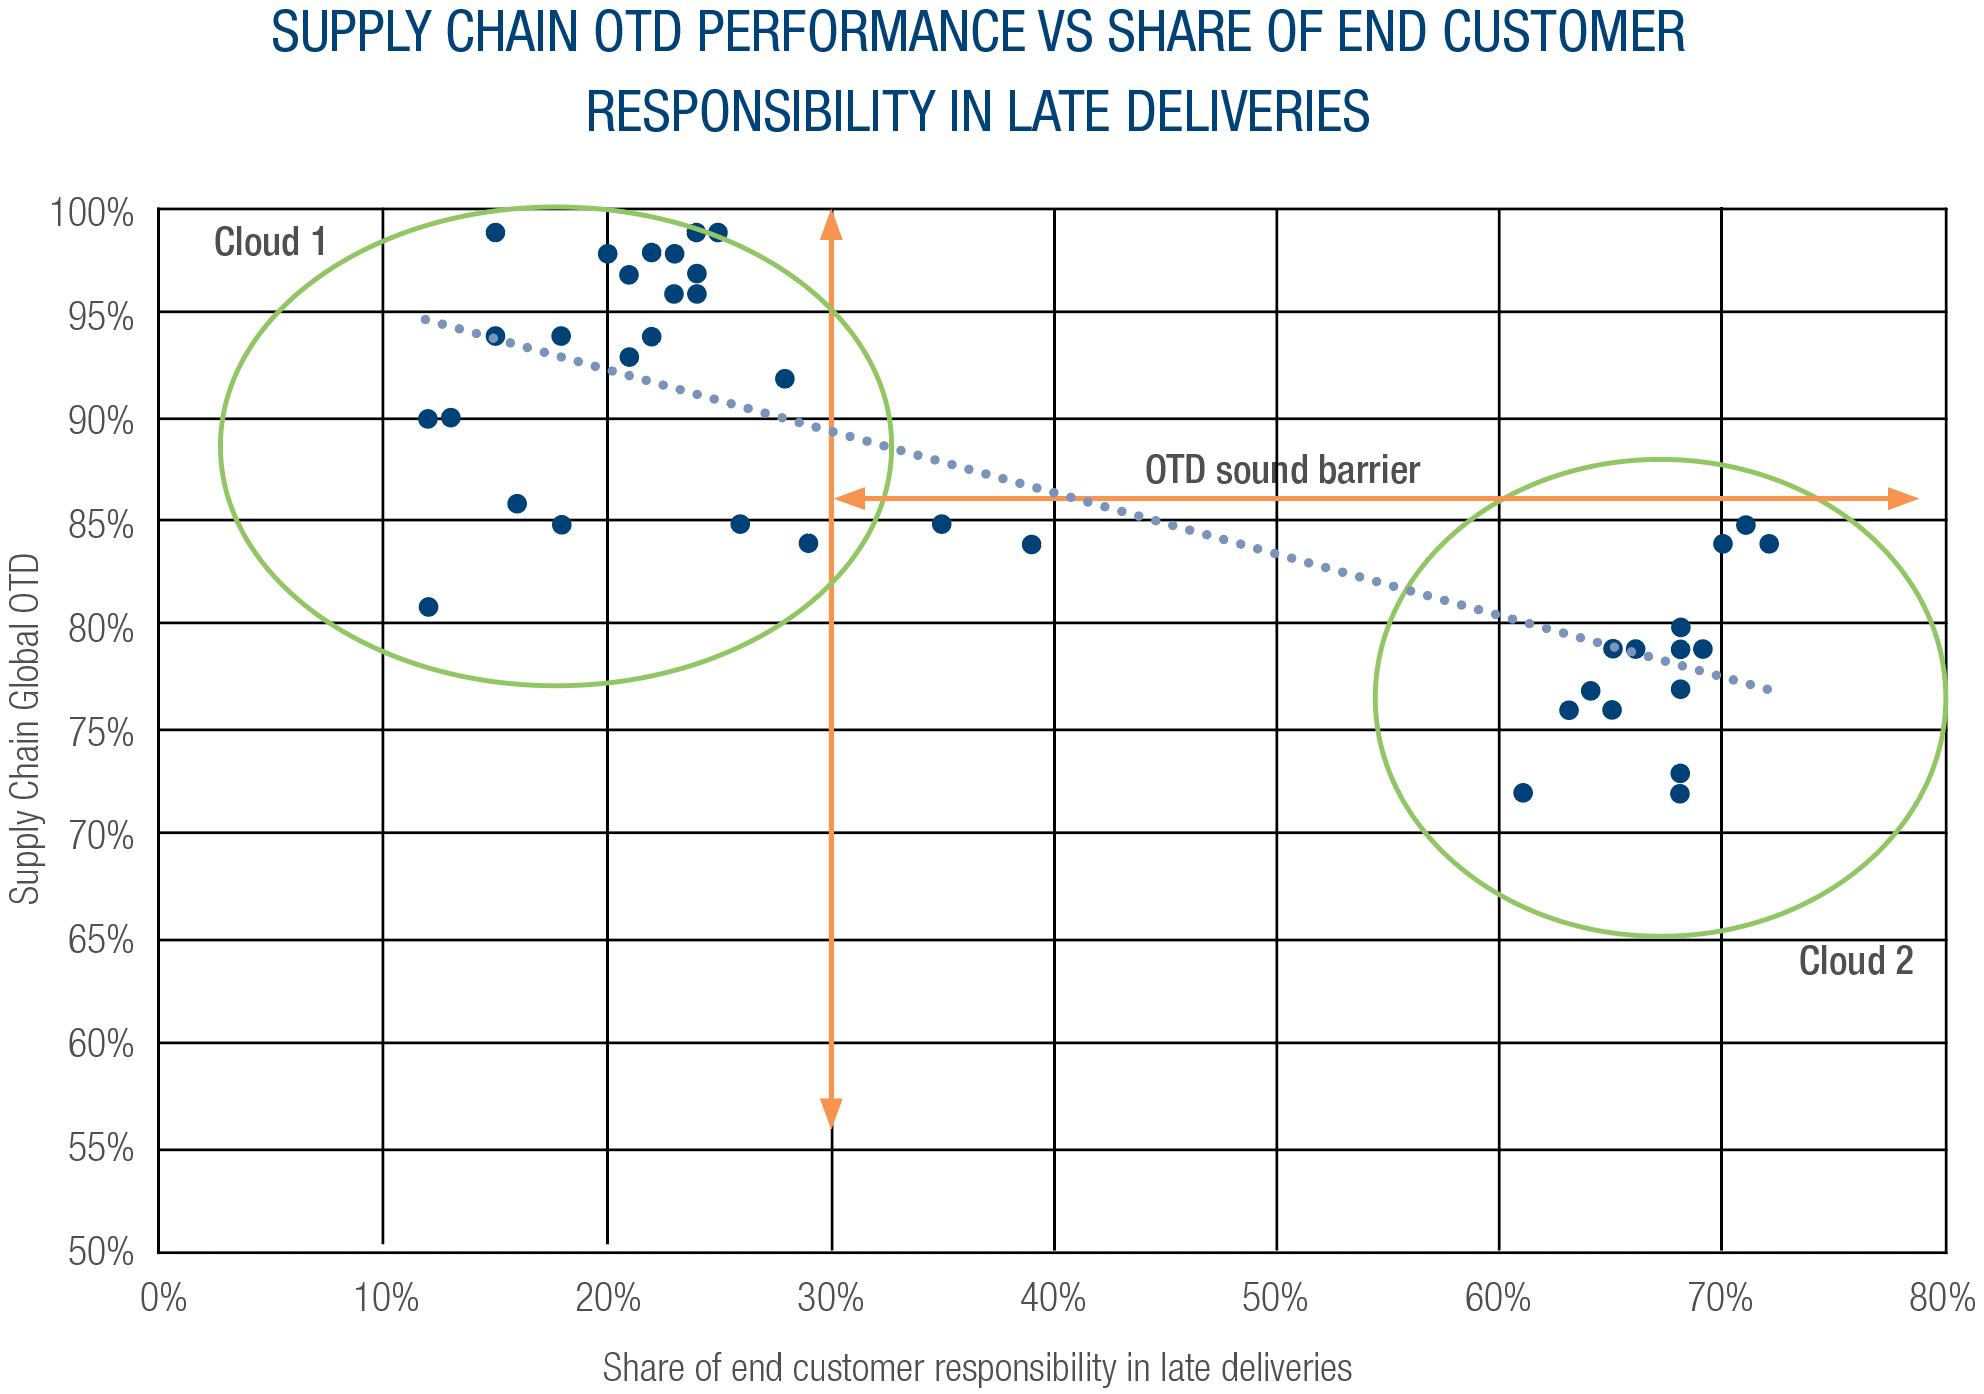
We clearly see two clouds of dots:
The upper left cloud is where the end customer is in the industry average for late deliveries impact, and OTD are up to 99%
The right cloud is showing under 85% with customer induced issues sometimes up to 80%
So, we conclude that:
For customers/suppliers that exhibit an industry standard share of late deliveries (around 30%), good to very good OTD is achievable.
For customers/suppliers that have a higher level of customer induced late deliveries, OTD is average and never exceeds 85%. We named it the OTD “sound barrier”.
If we observe the sequences over time, we have cases of supplier/customer being in cloud 1 for some time, going to cloud 2 because for example of engineering changes, and then back to cloud 1 after some months.
The OTD performance of a global supply chain is directly correlated with the discipline and timely performance of the end customer organization.
Given the high improvement potential that lays there and the ever-increasing pressure on production rates, it is time to tackle these issues and maybe start with a new situational awareness paradigm.